Every experienced investor has heard the phrase — "follow the smart money." But what does it actually mean? And more importantly, how do you do it as a retail investor in India? This beginner's guide breaks down everything you need to know about tracking institutional investor activity in the Indian stock market — and how to use it to make better investment decisions.
What Is "Smart Money" in the Stock Market?
"Smart money" refers to capital invested by large, experienced, and well-informed institutions — entities that have access to research, data, and analytical resources that most retail investors don't. In India, smart money primarily comes from:
- Foreign Institutional Investors (FII) / Foreign Portfolio Investors (FPI) — global funds like mutual funds, hedge funds, pension funds, and sovereign wealth funds from outside India.
- Domestic Institutional Investors (DII) — Indian mutual funds, insurance companies, banks, and pension funds like LIC and EPFO.
- High Net Worth Individuals (HNI) — ultra-wealthy investors who often move markets in mid-cap and small-cap segments.
- Promoters — company insiders whose buying or selling activity is a strong signal about business health.
These institutions collectively manage lakhs of crores. When they move into a stock, price usually follows. That's why tracking their activity gives retail investors a significant edge.
Why Should Retail Investors Track Smart Money?
Here's the uncomfortable truth — retail investors are almost always last to know. By the time a stock appears in news headlines or gets popular on social media, institutions have already built their positions. The price has already moved.
Tracking smart money helps you:
- Identify which sectors institutions are bullish or bearish on — before the broader market catches on.
- Spot accumulation in mid-cap and small-cap stocks — where institutional buying often precedes major price moves.
- Avoid stocks where institutions are silently exiting — a pattern that often leads to sharp corrections.
- Time your entry better — buying alongside institutions, not after they've already exited.
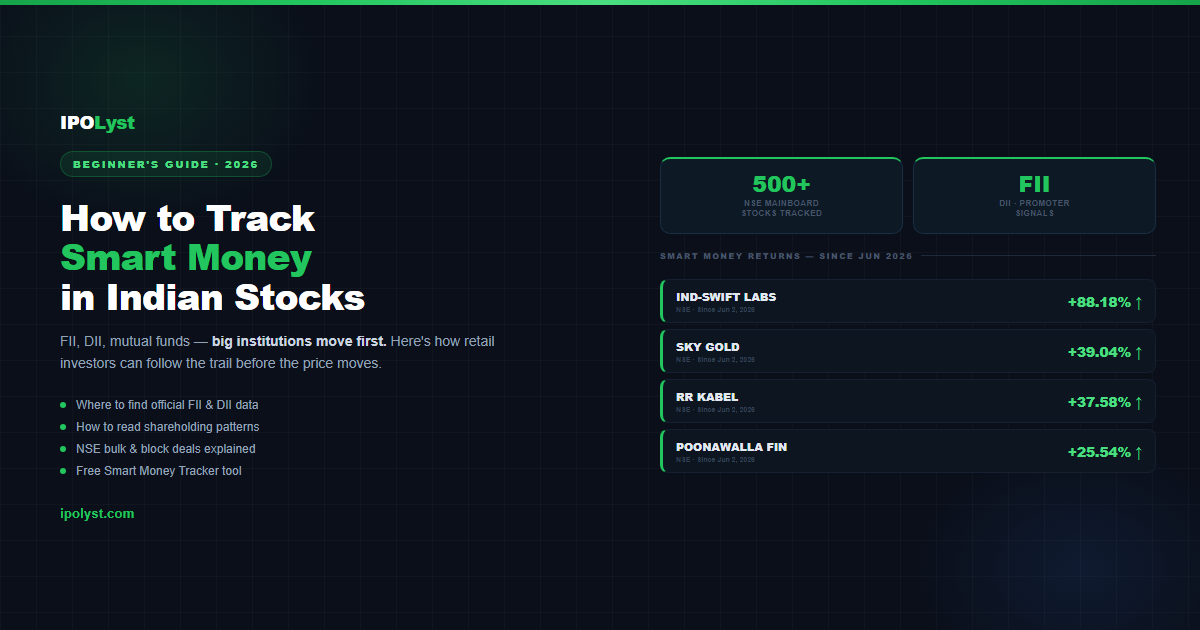
Consider this: Ind-Swift Labs, a mid-cap pharma stock, saw institutional accumulation in May-June 2026. By August 2026, it was up over 88% from its June baseline. Retail investors who tracked this movement early had a meaningful advantage.
Where Does Smart Money Data Come From?
In India, institutional activity is publicly available — but scattered across multiple sources. Here are the primary ones:
1. NSE and BSE Shareholding Pattern Filings
Every listed company must disclose its shareholding pattern every quarter to NSE and BSE. These filings show exactly what percentage of the company is held by FII, DII, mutual funds, promoters, and retail investors. A rising FII percentage quarter-over-quarter is a strong bullish signal.
Where to find it: NSE India (nseindia.com) → Company → Shareholding Pattern
2. SEBI FPI Data (Monthly)
SEBI publishes monthly FPI (Foreign Portfolio Investor) activity data — net buy/sell figures across equity, debt, and hybrid segments. This gives a macro picture of whether foreign money is flowing into or out of Indian markets.
Where to find it: sebi.gov.in → Market Statistics → FPI Data
3. NSE Bulk and Block Deal Data
When a large institution buys or sells more than 0.5% of a company's equity in a single transaction, it must be reported as a bulk deal. Block deals (large off-market transactions) are also publicly reported. These are goldmines for spotting large-scale institutional entry or exit.
Where to find it: nseindia.com → Market Data → Bulk Deals / Block Deals
4. Mutual Fund Holdings (AMFI Data)
AMFI (Association of Mutual Funds in India) publishes the complete portfolio of every Indian mutual fund every month. You can see exactly which stocks every major fund — HDFC, SBI, Mirae, Nippon — is buying, holding, or selling. A stock appearing in multiple new fund portfolios in the same month is a strong signal.
Where to find it: amfiindia.com → Research & Information → Portfolio Disclosure
5. Promoter Shareholding Changes
When a promoter increases their stake, it signals strong confidence in the company's future. When they reduce it, it warrants caution. These changes are disclosed via NSE/BSE filings and are often leading indicators of business performance.
How to Read FII/DII Data — A Practical Example
Let's say you're looking at a mid-cap infrastructure company. Here's how you'd analyze smart money activity:
- Check shareholding pattern for last 4 quarters — is FII% increasing consistently?
- Check if any large mutual funds added this stock to their portfolio in the last 2-3 months.
- Look for bulk deals — did any institution buy a large block recently?
- Check if promoters have been buying in the open market.
If all four signals align — FII increasing, mutual funds adding, bulk deal purchased, promoter buying — that's a high-conviction smart money signal. These setups have historically preceded significant price moves in Indian markets.
Common Mistakes Beginners Make
- Following old data — Shareholding patterns are quarterly. A lot can change between two filings. Always look at the most recent quarter.
- Ignoring context — FII selling doesn't always mean the stock is bad. Global factors like dollar strengthening or rate hikes cause FII outflows from all emerging markets simultaneously.
- Confusing FII buying with quality — Institutions make mistakes too. Smart money data is one signal, not the final verdict. Always combine it with fundamentals.
- Only looking at large caps — The best smart money signals often come from mid-cap and small-cap stocks where institutional coverage is lower and the alpha is higher.
- Not tracking consistently — One month of data means nothing. Track patterns over 3-6 months for meaningful signals.
How to Track Smart Money on IPOLyst — Free Tool
Manually tracking smart money across 500+ stocks using NSE filings, AMFI data, and SEBI reports takes hours. That's why IPOLyst built the Smart Money Tracker — a free tool that aggregates institutional movement data across 500+ NSE mainboard companies in one place.
The Smart Money Tracker on IPOLyst shows you:
- Price movement since June 2026 baseline — so you can see which stocks have moved since institutions started accumulating.
- Sector-wise institutional activity — quickly filter by sector to spot where money is rotating.
- FII and DII activity signals — all mainboard NSE companies, no SME stocks.
- Real NSE data, updated regularly — not estimates or guesses.
For example, stocks tracked on IPOLyst's Smart Money Tracker since June 2026 include Ind-Swift Labs (+88%), Sky Gold (+39%), RR Kabel (+37%), and Poonawalla Finance (+25%) — all showing strong institutional accumulation patterns.
The tracker is completely free. You don't need to register or pay anything. Visit ipolyst.com and navigate to Smart Money Tracker to explore it.
Key Things to Remember
- Smart money = FII, DII, mutual funds, HNI, and promoters.
- Data is publicly available — NSE, BSE, SEBI, and AMFI publish everything.
- Track patterns over 3-6 months, not single months.
- Combine smart money signals with fundamentals for the best results.
- Use tools like IPOLyst's Smart Money Tracker to save time.
Conclusion
Tracking smart money is not a strategy reserved for hedge funds and institutional desks. In India, all the data is publicly available — you just need to know where to look and how to interpret it. As a retail investor, consistently tracking FII/DII activity, shareholding pattern changes, and bulk deal data puts you ahead of most market participants.
Start small — pick 5-10 stocks you're interested in and track their institutional ownership every quarter. Over time, you'll develop the pattern recognition that separates informed investors from those who always seem to buy at the top.
Disclaimer: This article is for informational and educational purposes only and does not constitute financial advice. IPOLyst is not a SEBI-registered investment advisor. Please conduct your own research and consult a qualified financial advisor before making any investment decisions.