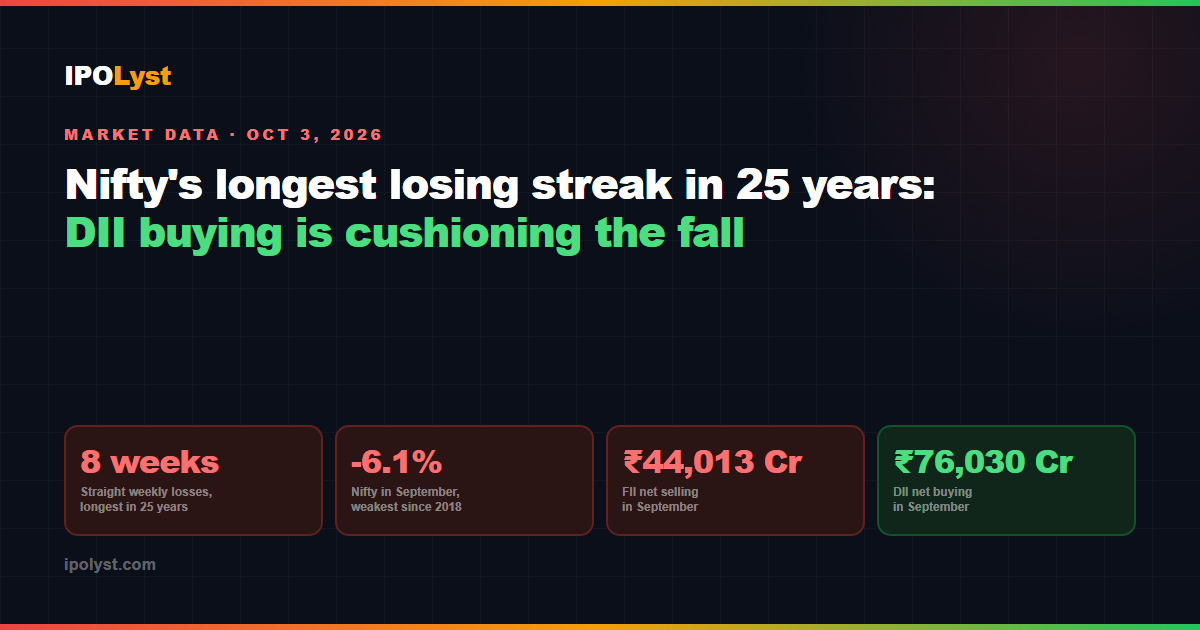
The Nifty 50 has fallen for eight straight weeks, its longest weekly losing streak in 25 years, with about 8.7% knocked off the index over the run. Foreign investors sold a net ₹44,013 Cr of Indian stocks in September, yet domestic institutions bought ₹76,030 Cr, about 1.7 times as much. That domestic buying, backed by record SIP inflows, has cushioned the fall. It has not stopped it. Here is the data, and what it can and cannot tell you.
How Long and How Deep the Fall Has Been
- Eight consecutive weekly losses for both the Sensex and the Nifty, the longest streak in 25 years.
- Over the eight weeks the Nifty is down about 8.7% and the Sensex about 8.4%, according to Business Today. Outlook Money puts the wealth erased at ₹28.29 lakh crore.
- In the holiday-shortened week ended October 1, the Sensex fell 1,986.04 points, or 2.68%, to 71,909.70, and the Nifty closed at 22,421.95, down about 3.1%. Markets were shut on October 2 for Gandhi Jayanti.
- The Nifty is down nearly 13% in 2026, and September's 6.1% fall was its weakest September since 2018, per Moneycontrol.
For perspective, the longest losing streak on record was 10 weeks in 1993, when the Nifty fell 22.90%. A seven-week streak that ended on September 21, 2001 cost 20.50%. The current streak is longer than the 2001 one but far shallower so far, by our comparison of those figures.
Single sessions have been brutal. On September 28 about ₹8.88 lakh crore of market value was erased in a day, as we covered in why the Indian stock market is falling. WION reported that ₹9.5 lakh crore was wiped out within one hour on October 1. For how the slide began, see our earlier look at the five-week decline.
FII Selling: ₹44,013 Cr in September
Foreign institutional investors sold a net ₹44,013 Cr of Indian equities in September 2026, about 11% of their roughly ₹4.03 lakh crore of outflows so far this year, according to Moneycontrol.
- Nearly two-thirds of the month's selling, ₹29,175 Cr, came in the last four trading sessions.
- September 30 saw ₹10,148 Cr of foreign selling, the largest single-day outflow since March 23.
- On October 1, foreign investors sold a further ₹9,484.22 Cr, and weekly FII selling was about ₹35,000 Cr, per Business Today.
FII totals differ by source and method. Outlook Money, for example, cites ₹35,861 Cr of foreign selling for September, which suggests a different basis or cut-off date. We use the Moneycontrol figure here and have not seen any source that calls it a record.
DII Buying: ₹76,030 Cr in September
Domestic institutional investors, a group that includes mutual funds and insurers, were net buyers of ₹76,030 Cr in September. That is about 1.7 times the FII selling of ₹44,013 Cr, a net gap of roughly ₹32,000 Cr in domestic investors' favour, by our calculation.
- On September 30, DIIs bought ₹11,271.73 Cr against ₹10,148 Cr of FII selling.
- On October 1, DIIs bought ₹10,041.84 Cr against ₹9,484.22 Cr of FII selling.
On both of the last two sessions of the period, domestic buying was larger than foreign selling, yet the Nifty still closed lower each time.
The SIP Factor: A Steady, Price-Agnostic Flow
A systematic investment plan invests a fixed amount every month regardless of where the market is. That makes SIP money price-agnostic, and it is one reason domestic funds keep receiving cash during a fall.
- AMFI data for August 2026 shows SIP contributions of ₹32,297 Cr, the highest on record.
- Contributing SIP accounts reached a record 10.2 crore, up from 9.9 crore in July, so the 10 crore milestone has been crossed.
- SIP assets under management stood at ₹18.61 lakh crore, about 21.4% of the industry's ₹87.08 lakh crore, and equity funds saw inflows for a 66th straight month.
- Moneycontrol estimates domestic retail SIPs bring in about $3 billion to $3.5 billion a month.
AMFI normally publishes September's SIP numbers in the first half of October, so those figures are not yet out.
Is the SIP Wall Really Holding the Market Up?
It is a fair reading that steady domestic inflows have softened the fall, but the data does not support the stronger claim that they have stopped it. Three reasons for caution, the first two being our own analysis:
- DII flows come from more than SIPs. Insurers, pension money and other institutions are in the total, so we cannot say how much of the ₹76,030 Cr is SIP-driven.
- The index fell 6.1% in September and eight weeks in a row despite that buying, so the cushion has limits.
- Analysts quoted by Multibagg note that domestic buying does not necessarily reverse a move straight away.
Experts quoted by Outlook Money frame the fall as largely a valuation correction driven by outside forces. Akshat Garg of Choice Wealth called it a valuation correction from external macro pressure, not a fundamental deterioration. Devender Singhal of Kotak Mutual Fund said the first half of FY27 saw earnings downgrades and cautious management commentary, but expects conditions to improve in the second half.
What to Watch Next
- The RBI policy decision. Business Today reports a 25 basis point rate hike is expected on October 7.
- US 10-year Treasury yields, which are at their highest since mid-June 2007, and Brent crude above $100 a barrel.
- The rupee, which has weakened past 96 to the US dollar.
- AMFI's September SIP data and the next FII and DII figures, to see whether the pattern holds.
What This Means for IPO Watchers
Weak markets usually cool new-listing sentiment, but heavily subscribed issues still listed strongly last week, as we showed in our report on this week's IPO listings. You can follow every open issue on the IPO GMP tracker. None of this tells you whether to apply to any specific IPO.
Figures were checked against Business Today's October 2 market report, Outlook Money's analysis of the eight-week streak, Moneycontrol's report on FII selling and the Nifty's 2026 fall, The Week's report on the losing streak and AMFI's August 2026 SIP data.
Frequently Asked Questions
How long has the Nifty been falling?
The Nifty and Sensex have fallen for eight straight weeks, the longest weekly losing streak in 25 years. The Nifty is down about 8.7% over the streak and nearly 13% in 2026 so far.
How much did FIIs sell and DIIs buy in September 2026?
Foreign institutional investors sold a net ₹44,013 Cr, while domestic institutional investors bought a net ₹76,030 Cr, about 1.7 times as much. Figures differ slightly across sources because of different methods and cut-off dates.
Have SIPs crossed 10 crore accounts?
Yes. AMFI data shows contributing SIP accounts reached 10.2 crore in August 2026, up from 9.9 crore in July, with record monthly SIP contributions of ₹32,297 Cr.
Should I pause my SIP during a market fall?
IPOLyst cannot tell you that, and this article is not advice. A SIP is designed to invest a fixed amount regardless of market level, so pausing changes that design. The right choice depends on your goals, time horizon and cash needs, so consider speaking to a registered financial advisor.
Disclaimer: This article is for informational and educational purposes only and does not constitute financial or investment advice. IPOLyst is not a SEBI-registered investment advisor. Investments in securities markets are subject to market risk. Market data, flow figures and price levels can change quickly and differ across sources. Please verify figures with official sources and consult a registered advisor before making investment decisions.