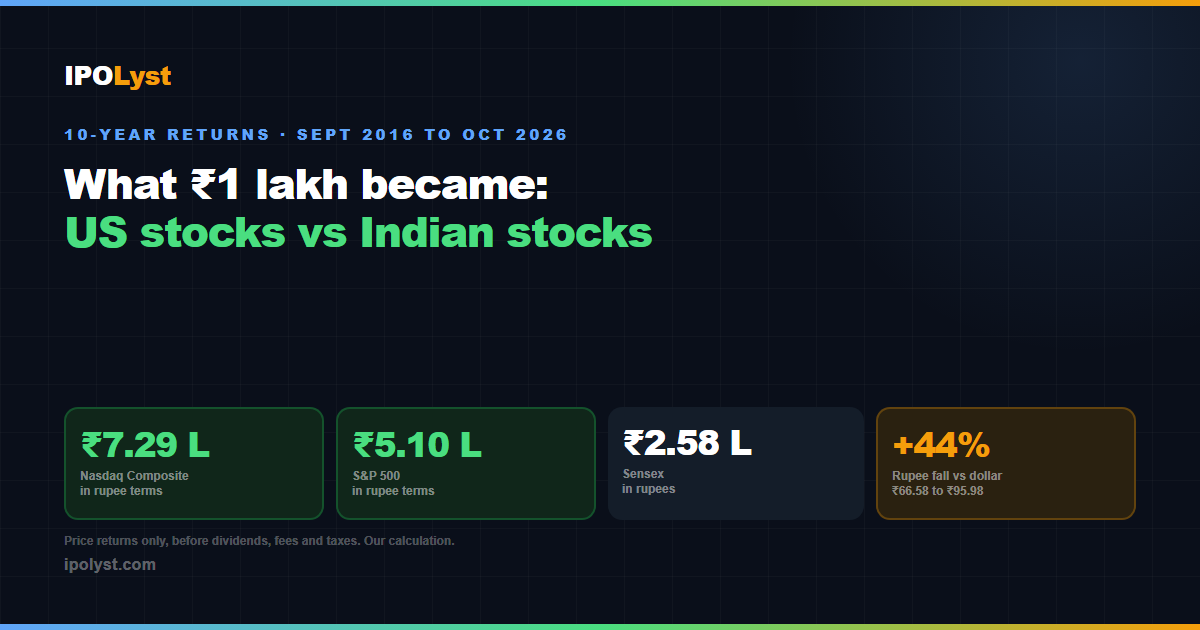
Over the ten years from September 30, 2016 to October 1, 2026, ₹1 lakh put into the Nasdaq Composite would have grown to about ₹7.3 lakh in rupee terms, the S&P 500 to about ₹5.1 lakh and the Sensex to about ₹2.6 lakh. Two things explain the gap: US indices rose faster, and the rupee fell about 44% against the dollar, which added to the rupee value of anything held in dollars. These are our own price-return calculations from verified index levels, before dividends, fees and taxes, and the details matter, so here is how the numbers work.
Ten-Year Price Returns, Index by Index
Using closing levels on September 30, 2016 and October 1, 2026, and counting price change only:
- Nasdaq Composite: 5,312 to 26,871.60, up 405.9%, or about 17.6% a year.
- S&P 500: 2,168.23 to 7,666.45, up 253.6%, or about 13.5% a year.
- Dow Jones Industrial Average: 18,308.08 to 50,926.56, up 178.2%, or about 10.8% a year.
- Sensex: 27,865.96 to 71,909.70, up 158.1%, or about 9.9% a year in rupees.
The US figures are in dollars and the Sensex figure is in rupees, so they are not yet comparable. The next section puts them on the same footing.
The Rupee Effect: Why Dollars and Rupees Tell Different Stories
The rupee closed at about ₹66.58 per dollar on September 30, 2016 and was at ₹95.98 at the September 28, 2026 close, the latest level we verified. That is a 44% fall, or about 3.7% a year.
- For an investor holding Indian stocks, that depreciation eats into dollar returns. The Sensex's 158.1% rise becomes about 79.0% in dollars, roughly 6.0% a year, by our calculation.
- For an Indian holding US stocks, the same fall in the rupee adds to returns. The Nasdaq Composite's 5.06 times becomes about 7.29 times in rupees, the S&P 500's 3.54 times becomes about 5.10 times, and the Dow's 2.78 times becomes about 4.01 times.
Published research on the Nifty 50 shows the same drag. Multibagg, citing Samco data on total returns, puts the Nifty 50 at about 11.7% a year in rupees but 7.93% a year in dollars over 2016 to 2026, against 14.8% for the S&P 500. Applying today's weaker rupee to the 11.7% figure gives about 7.7%, by our calculation, so the dollar-terms number is somewhat lower the further the rupee falls.
Why the Figures You See Online Do Not Match
Circulating ten-year numbers for the same index vary a lot. We found S&P 500 ten-year figures of 12.57%, 12.67%, 14.8% and 15.3% a year from different sources, and they differ because of the start date, whether dividends are included, and whether the Nasdaq figure is for the Composite or the Nasdaq-100.
For example, a Nasdaq gain of 461% works out to 18.8% a year, and an S&P 500 gain of 317% works out to 15.3% a year over ten years, so that arithmetic holds. But both are higher than the price returns of the Nasdaq Composite and S&P 500 that we calculated on the window above. The likely reasons are dividends, a different Nasdaq index or a different window. Compare numbers only when they use the same index, window, return type and currency.
The Hang Seng: A Lost Decade
Hong Kong's Hang Seng Index has returned only about 1% a year over the last ten years, with sources giving 1.04% and 1.23%, so a rough 1% to 2% range depending on whether dividends are included. The long-run record is very different: Endowus-cited data shows a price CAGR of about 8.9% in Hong Kong dollars from April 1974 to April 2026. A decade of almost no growth is a reminder that a market can go sideways for a very long time.
What We Left Out
We could not find verified September 2016 starting levels for Japan's Nikkei 225, Germany's DAX or the UK's FTSE 100, so we have not calculated returns for them and will not guess. If you compare those markets elsewhere, check that the source states its start date, currency and whether dividends are included.
Before You Draw a Conclusion
- The end date matters. India's market is in a bad stretch, with the Nifty down nearly 13% in 2026 and eight straight weekly losses, so a ten-year window ending now flatters the US comparison. That is our own observation, not a forecast.
- Past returns are not a guide to future returns. The rupee could strengthen, which would reverse part of the currency benefit.
- Our figures exclude dividends, fund fees, taxes and any remittance costs. Rules for investing abroad from India, including limits and tax collected at source, change, so check the current rules.
- US indices are heavily weighted to large technology companies, so their returns carry sector concentration that the Sensex does not.
For the current state of the Indian market, see our reports on the Nifty's eight-week losing streak and why the Indian stock market is falling.
What This Means for IPO Watchers
Long-run index returns say little about any single IPO. You can follow every open and upcoming issue on the IPO GMP tracker, and none of this tells you whether to apply to any specific issue.
Figures were checked against Multibagg's Nifty versus S&P 500 analysis, TheStreet's October 1 market report, Business Today's October 2 report on Indian markets, historical USD/INR rates for 2016 and Endowus's Hang Seng returns data.
Frequently Asked Questions
How much would ₹1 lakh in US stocks have become in 10 years?
By our price-return calculation from September 30, 2016 to October 1, 2026, ₹1 lakh would have become about ₹7.29 lakh in the Nasdaq Composite and about ₹5.10 lakh in the S&P 500 in rupee terms, helped by the rupee falling about 44% against the dollar. This excludes dividends, fees and taxes.
What did the Nifty 50 return in dollars over 10 years?
Published data puts the Nifty 50 at about 11.7% a year in rupees and 7.93% a year in dollars, with the gap caused by rupee depreciation. At today's weaker rupee, our estimate for the dollar figure is closer to 7.7%.
Why do different sites show different 10-year returns for the S&P 500?
They use different start dates, include or exclude dividends, and sometimes use the Nasdaq-100 rather than the Nasdaq Composite. We found S&P 500 ten-year figures from about 12.6% to 15.3% a year. Always check the window, return type and currency before comparing.
Should I move my money into US stocks?
IPOLyst cannot tell you that, and this article is not advice. Past returns do not guarantee future returns, the currency effect can reverse, and costs and taxes apply. Consider speaking to a registered financial advisor.
Disclaimer: This article is for informational and educational purposes only and does not constitute financial or investment advice. IPOLyst is not a SEBI-registered investment advisor. Past performance is not a guarantee of future returns. Investments in securities markets are subject to market risk. Index levels, exchange rates and published return figures differ by source and date, so please verify figures with official sources and consult a registered advisor before making investment decisions.